That's the cherry-picking method at the heart of climate denial, and it's at work again in a story by David Rose first published by the Mail on Sunday claiming that "Global warming stopped 16 years ago, reveals Met Office report quietly released... and here is the chart to prove it". It's doing the rounds.
Whilst the UK Met Office was reported as the source of the figures, they were in fact quick to issue a rebuttal, noting that it is "the second article Mr Rose has written which contains some misleading information, after he wrote an article earlier this year on the same theme".
Rose's article cherry-picks a starting point in August 1997 at the height of an El Nino (where temperatures are higher) and finishes in August 2012 at the tail end of a double-dip La Nina (when temperatures are cooler). The Met explains:
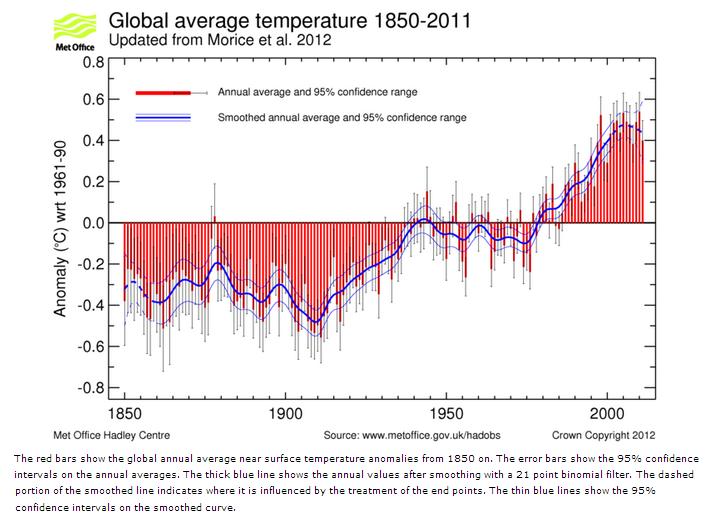
As we’ve stressed before, choosing a starting or end point on short-term scales can be very misleading. Climate change can only be detected from multi-decadal timescales due to the inherent variability in the climate system. If you use a longer period from HadCRUT4 the trend looks very different. For example, 1979 to 2011 shows 0.16°C/decade (or 0.15°C/decade in the NCDC dataset, 0.16°C/decade in GISS). Looking at successive decades over this period, each decade was warmer than the previous – so the 1990s were warmer than the 1980s, and the 2000s were warmer than both. Eight of the top ten warmest years have occurred in the last decade.Over the last 160 years the warming trend is clear, as this graph shows:
 |
| Click to enlarge |
Over the last 140 years global surface temperatures have risen by about 0.8ºC. However, within this record there have been several periods lasting a decade or more during which temperatures have risen very slowly or cooled. The current period of reduced warming is not unprecedented and 15 year long periods are not unusual.The evidence is overwhelming that the planetary system is absorbing more heat as the blanket of greenhouse gases thickens. Around 90 per cent of that heat is going into the oceans (see graph below) and is continuing to do so, and of the rest most is melting ice sheets at both poles, with only around 3–4 per cent of the energy imbalance going to heat the atmosphere, whose mass is tiny compared to that of the ice sheets and the oceans.
Fluxes of heat between the atmosphere and the ocean can provide short term variations very different from the long-term trend. This is why atmospheric temperatures are higher during El Nino periods and lower during La Nina periods. And that's precisely the cherry-picking at work in the case of this story.
If you want more evidence, Joe Romm has collected Ten Charts That Make Clear The Planet Just Keeps Warming.
And Climate Nexus have produced this handy fact-sheet (click for full A4 size version), reproduced here:
 |
| Click to enlarge. Courtesy Climate Nexus. |